
120,000 Posts, One Month
The surprising scale — and shape — of local government communication across America.
4/9/20265 min read
Government Runs on a Monday-to-Friday Schedule — Mostly
One of the clearest patterns in the data is how sharply posting volume tracks the workweek. On a typical weekday in March, GovFeeds was pulling in close to 5,000 posts. On weekends, that dropped to around 1,600 — less than a third of the weekday volume. The implication is exactly what you’d expect: most local government social media is being managed by communications staff who work regular business hours, and when they’re off, the feed goes quiet.
March 16 — a Monday — was the single busiest day of the month at 6,299 posts. This was no coincidence: it fell the day after the first major Maui kona storm peaked, meaning the national post volume spiked alongside a concentrated surge from Maui County alone as storm and recovery communications flooded the feed. The quietest days were weekend dates in the final stretch of the month.
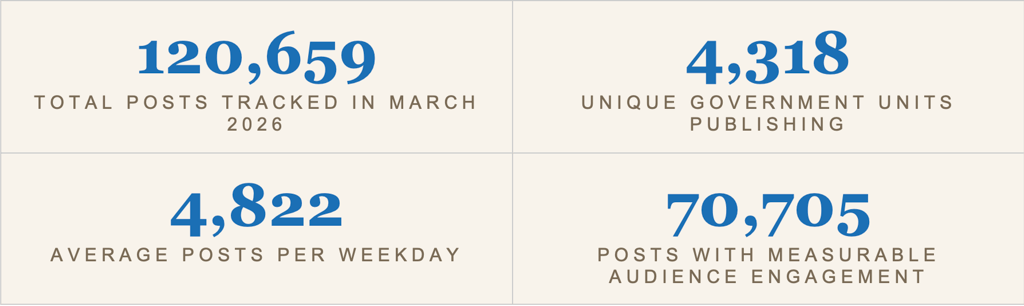
Weekdays averaged roughly 4,822 posts per day. Weekends averaged about 1,620 — a 3-to-1 ratio that speaks to how much of local government communication depends on staffed offices and working hours.
What Are They All Talking About?
When you look at what 120,000 posts are actually about, a few categories dominate. Weather and emergency communications were the single largest bucket — which makes sense, given that March brought serious storm events to multiple regions of the country. Public safety content from police and sheriff departments was a consistent presence throughout the month. Community events, infrastructure and road work updates, and budget or service announcements rounded out the top themes.
Here’s a number worth sitting with: in March 2026, the local government units tracked by GovFeeds published 120,659 social media posts. That’s 4,318 cities, counties, townships, and special districts — from tiny towns of a few hundred people to major metropolitan counties — putting information out into the world, every weekday, all month long.
Most of those posts will never be read by anyone outside their immediate community. A road closure notice in rural Ohio. A water main repair update from a small Georgia city. A spring cleanup reminder from a township in Pennsylvania. Each one is completely mundane from the outside, and genuinely important to the people it’s meant for. Put them all together, though, and something more interesting emerges: a real-time picture of what American local government is actually doing, saying, and worrying about — at a scale that’s almost impossible to grasp without seeing the numbers.
We pulled together March’s data to share some of what’s in there. The patterns are worth knowing.
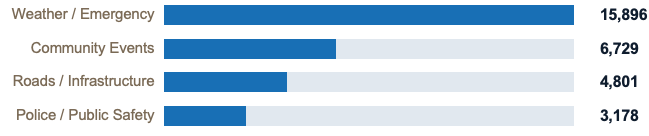

The weather and emergency number — nearly 16,000 posts — is striking. That’s more than 500 emergency or weather-related government posts per day, on average. Some of that is routine, but a meaningful chunk represents actual, real-time crisis communication: road closures, flood warnings, shelter activations, evacuation notices. The idea that this information exists, at that volume, and that most of it disappears into the void unmonitored — that’s the thing that motivates us to build this product.
Most Posts Go Unnoticed. A Few Hit Hard.
GovFeeds assigns engagement ratings to posts that generate measurable audience response — from one star for posts that perform at baseline up to five stars for the rare content that breaks through. Of the 70,705 posts in March that received an engagement rating, the distribution tells a story about what government communication actually looks like in the wild.
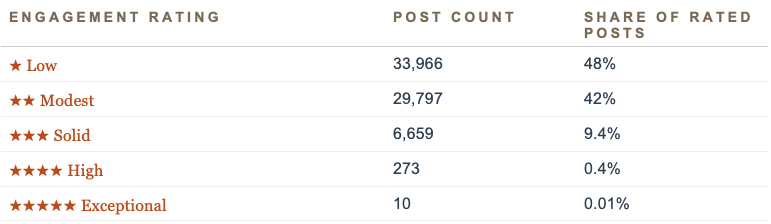

The vast majority of what government posts — nearly 90 percent — earns one or two stars. That’s the steady, low-engagement background noise of municipal communication: event reminders, permit information, board meeting notices. Genuinely useful to the people who need it, largely invisible to everyone else.
The ten five-star posts are a different story. Every single one of them involved either a natural disaster, an emergency, or a human-interest story with strong emotional resonance. The Maui kona storm dominated the list — multiple posts from County of Maui during the peak emergency days reached five stars. City of Snoqualmie’s photos of the falls flooding on the first day of spring made the cut. A hero tribute from the City of Lakeland. A Medal of Honor spotlight from a small South Carolina municipality. The pattern is consistent: people engage with government content when it either affects their safety or touches something human about the community they live in.
Nearly 16,000 emergency and weather-related posts in a single month. Most disappeared unmonitored. A handful reached thousands of people at exactly the moment they needed the information most.
The Most Active Units Might Surprise You
The units that posted most frequently in March weren’t the major metros you might expect. Washington County led with 377 posts — nearly a dozen posts a day, every day. Gwinnett County in Georgia was close behind at 357. Several small cities punched well above their weight: City of Spencer, Stacyville, Storm Lake. Some of these communities have clearly invested meaningfully in their digital communications capacity, treating their social feeds not as an afterthought but as a genuine channel for reaching residents.
Meanwhile, plenty of larger governments post far less frequently. The distribution is wide. Some units contribute dozens of posts a month; others post a handful. The median is something closer to a few posts a week — enough to maintain a presence, not enough to create a real-time information channel.
Why Any of This Matters
None of these numbers are abstract. Behind each of the 120,659 posts is a piece of information that someone, somewhere, needed. A road that closed unexpectedly. A neighborhood under a boil-water notice. A storm shelter that opened at 7 p.m. A water main that crews were racing to repair before morning. That information exists. It’s public. It was posted to social media. And without a feed like GovFeeds, there’s no practical way for anyone outside that immediate community to know it happened.
The people who need this information aren’t just residents. They’re vendors who serve government agencies and want to know when a county is in crisis. They’re journalists who cover a region and can’t follow four thousand accounts. They’re researchers studying emergency communication patterns, or insurance analysts modeling flood risk response, or policy teams tracking how cities communicate with residents. For all of them, the raw signal is there — it’s just scattered across thousands of municipal Facebook pages and X accounts, untethered from any centralized, searchable, monitorable system.
That’s what GovFeeds is. One hundred and twenty thousand posts in March. Every one of them searchable. All of them in one place.
Data reflects GovFeeds tracking of 4,318 government units for the month of March 2026. Category counts use keyword matching on post titles and may include posts matching multiple categories. Engagement ratings reflect comparative audience interaction within each unit’s historical baseline.
See the Full GovFeeds Data: Subscribe to get real-time access to tens of thousands of local government posts, searchable and delivered as a structured data feed at publicsquareanalytics.com →